Facebook Political Ads 2020: Ranking Of Facebook Ad Spend By Candidate
See how candidates stack up against one another in their Facebook Ad spend and quickly access live updates.

After weeks of teasing, we’re very proud to show off the results of our efforts, so prepare yourselves. Behold our:

…new Performance Dashboard! We’ve heard your suggestions and we’re excited to give you a consolidated view with powerful analytics. Let’s take a deep dive into each section:
At the very top we offer you two time frames: 30 Days and All Time. We thought it would be helpful to have a monthly and all-time retrospective to frame your content optimization. For all the screenshots below, we’ve taken data from the “All Time” perspective.
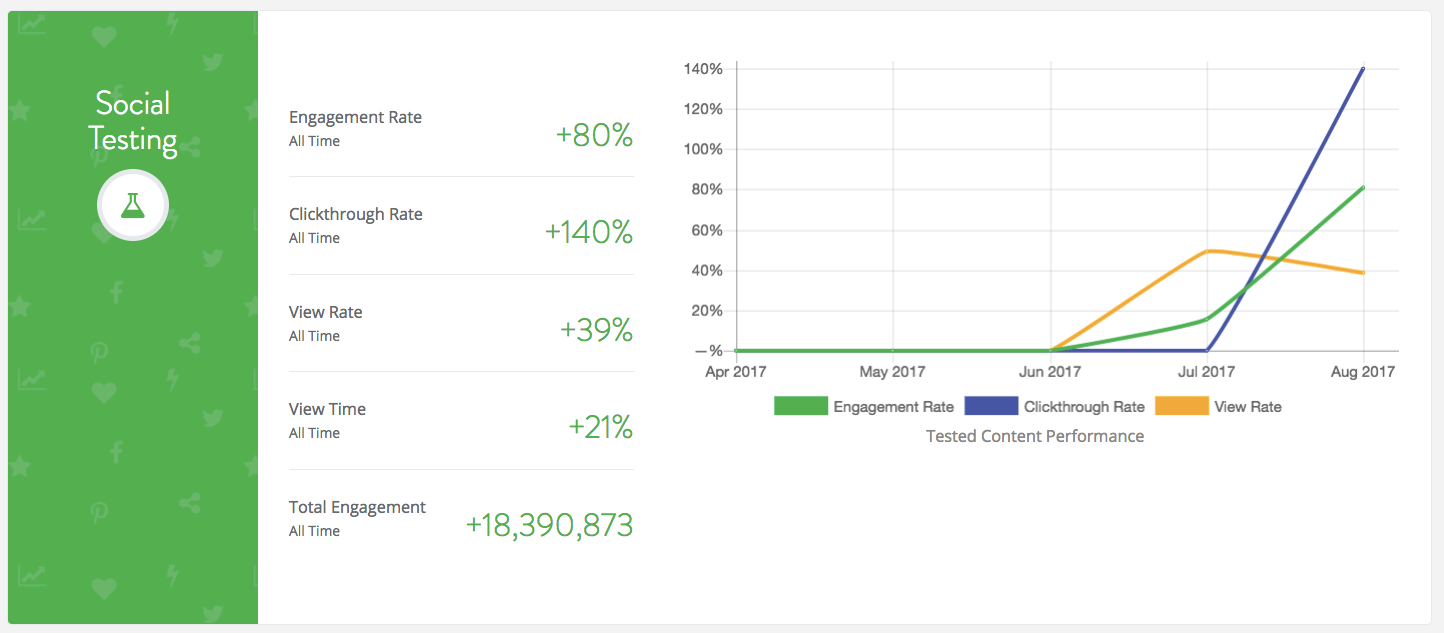
In the “Social Testing” section you’ll get an improved view of the old performance dashboard. Here we highlight your test-level results in aggregate and over time. You can see a macro perspective of Engagement Rate, Clickthrough Rate, 10 second View Rate, Average View Time and Total Engagement.
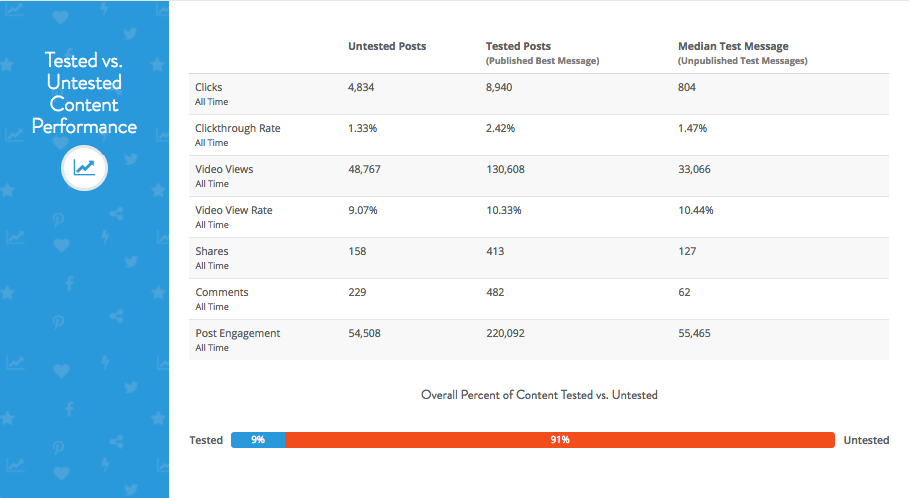
This is the section we’re most excited about! As long as you post your winning message to Facebook through Naytev, we’ll be able to carry through your earned test engagement and provide comparative insights to your historical Facebook Page Posts. A question that always comes with testing is “What’s the ROI?” With the new dashboard we wanted to clearly show your returns from testing.
Naytev analyzes your past posts to determine your typical untested post performance, and compares that with the performance of posts you’ve optimized with Naytev. To give you additional perspective, we share an estimate of how your median test message would have performed, as well as a breakdown of what percentage of your Page posts have been optimized.
If you were constantly wondering “what would have happened if I posted X,Y, Z messages,” you don’t have to wonder any longer!
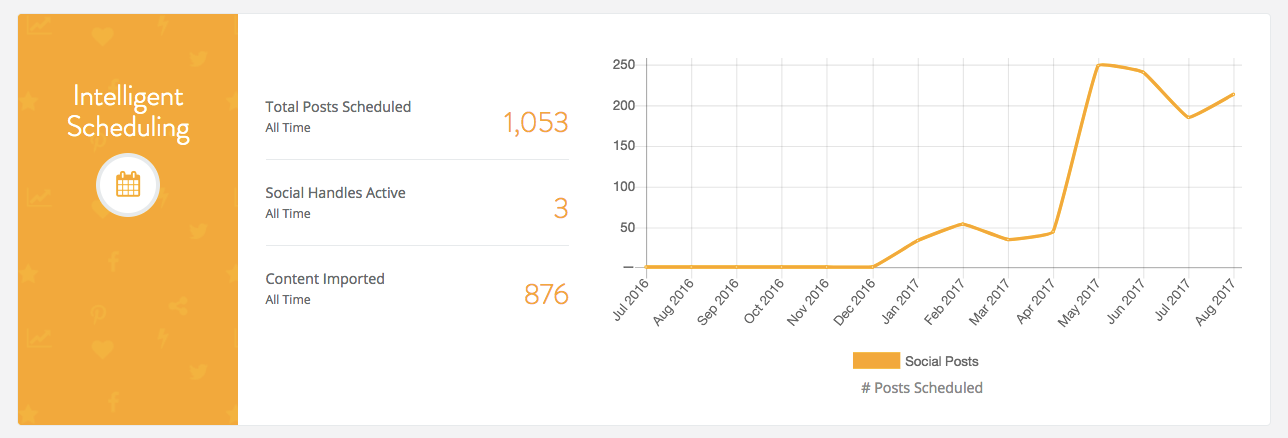
Through the Intelligent Scheduling section, you can see how much content you’re publishing through us, how many social handles you have attached to a specific team, and how much content is being imported via RSS or direct CMS integration. This is where you check the pulse on how your content is organized and if you’re streamlining your workflow for maximum efficacy.
Don’t know how to link your RSS Feeds to your account? Learn right here.
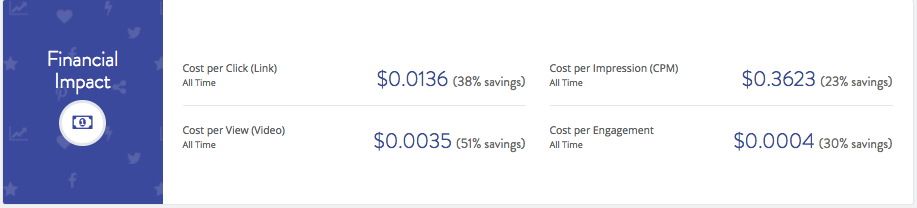
Naytev takes a unique approach of bridging paid and organic engagement for testing. With this in mind, we share the financial impact of optimizing your social content packaging. First, we’ll show you your average cost across key metrics - this is a weighted average, reflecting total budget spent divided by total engagement earned. We also calculate savings, comparing the weighted average cost metrics of your median performing test messages with those of your best messages. We do this automatically for you, so you can always keep tabs on your team’s return on investment.
As you know, by posting your winning message through Naytev you’re able to carry through engagement earned during the test to your organic Page post. Engagement from your Naytev testing and publishing falls into three categories: Paid Engagement, Organic-From-Paid Engagement, and Organic Page Engagement.
If you’re curious about these three buckets of engagement click here to learn more.
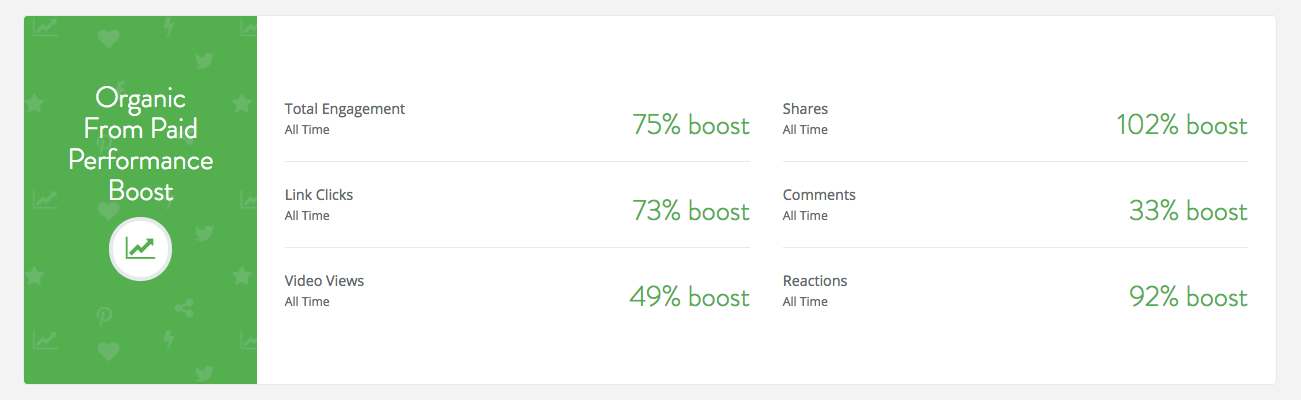
One of the most important buckets of engagement that we’ve isolated is organic-from-paid. When people directly interact with your test message, their friends may in turn see and organically engage with your test message. This downstream friend engagement is free, and represents what we call Organic-from-Paid. We track this information so you can see the full scope of your content performance.
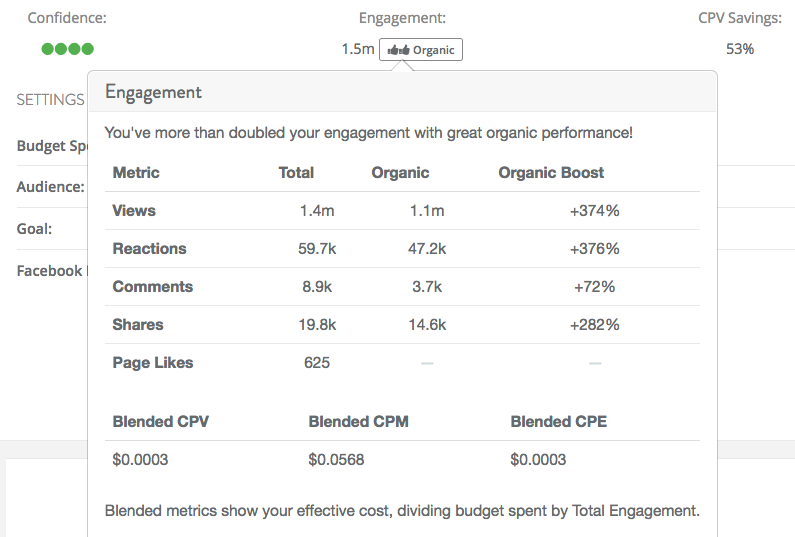
In addition to providing a macro view of your Naytev results in the Performance page, we also provide a deeper view in each Test Result page. Just hover over the “Engagement” value at the top of each Result page, and you’ll see a detailed engagement breakdown. “Total” equals the sum of Paid and Organic-From-Paid Engagement, and “Organic” is Organic-From-Paid broken out.
The Blended Metrics at the bottom of the pop-up shows the total engagement (sum of Paid and Organic From Paid) divided by the budget you’ve spent. Organic-from-Paid Engagement can quickly add up, yielding significant cost savings.
That’s a wrap! There are more exciting developments in the pipeline, so stay tuned, and in the meantime login to Naytev, and take a look at your performance!
Happy Testing!
See how candidates stack up against one another in their Facebook Ad spend and quickly access live updates.
Naytev’s Chief Strategy Officer, shares cutting-edge strategies on how communications teams can dramatically improve social media content performance for upcoming elections.
If you can't calculate the overall impact of any given piece of content, then it's impossible to make informed decisions about it.